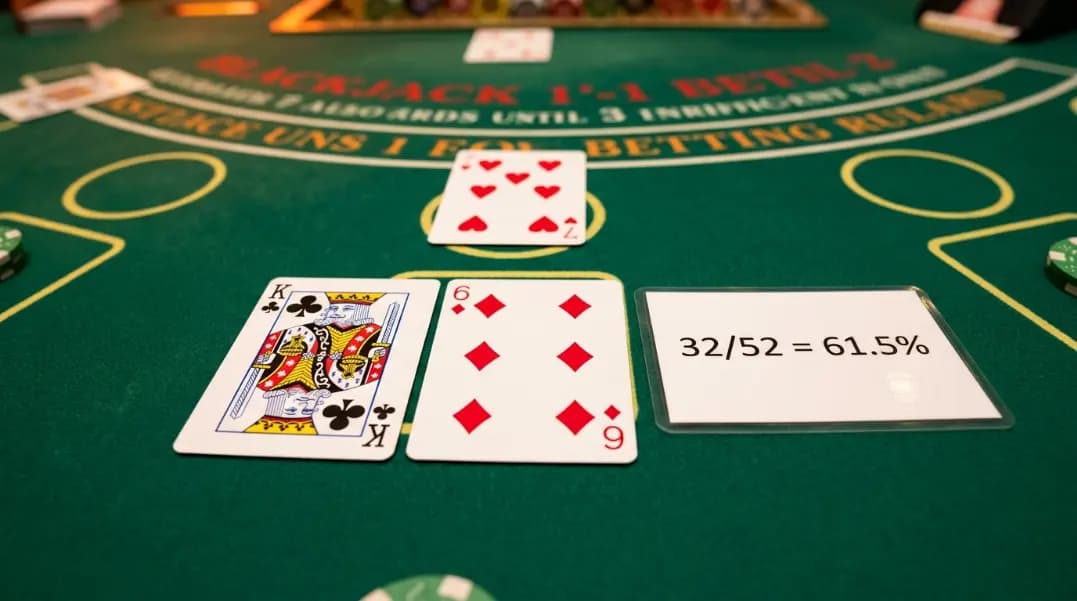
In Blackjack, the decision to hit on 16 against a dealer's 7 is one of the most argued calls in the game. Basic strategy says hit. The reasoning is not instinct. From a full 52-card deck, 32 cards are worth 6 or more in face value, any one of which pushes a 16-total hand past 21. That 32/52 figure, roughly 61.5 percent, is why standing on 16 loses more often than hitting, even though hitting busts most of the time too.
Card probability is not abstract. Every draw has a calculable result based on what remains in the deck, and each card removed changes the probability for every subsequent draw. This reference covers the exact numbers for common scenarios: single draws, sequential draws without replacement, poker hand frequencies, and the bust probabilities that drive Blackjack decisions.
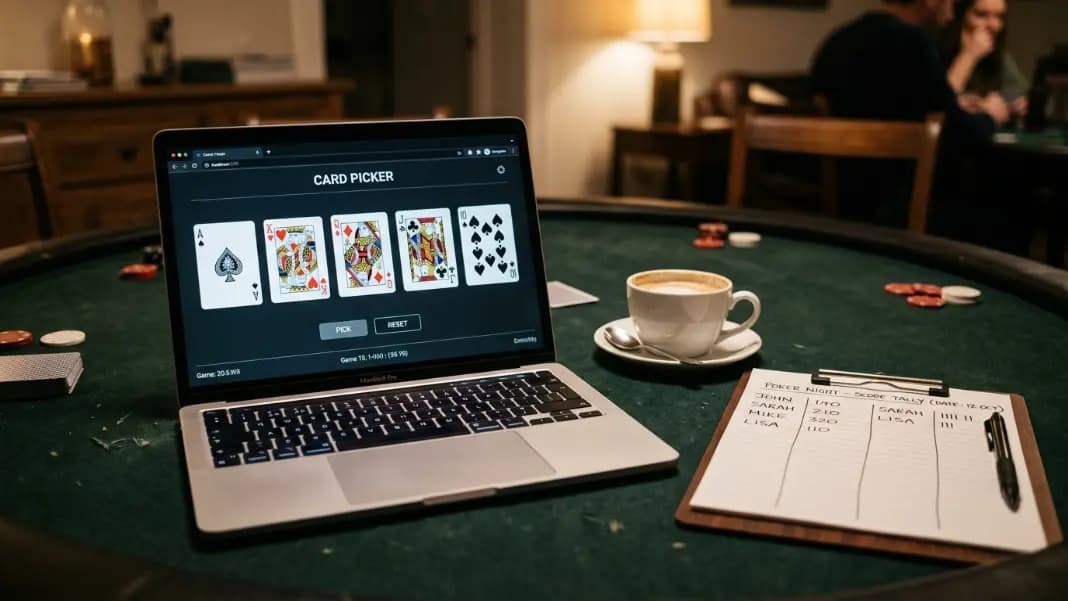
The card picker draws from this same 52-card deck and tracks remaining cards within a session, which makes it useful for running probability exercises where the numbers become visible across many hands rather than staying on paper. Use the formulas here to understand what the tool is doing with each draw.
The Structure of a 52-Card Deck
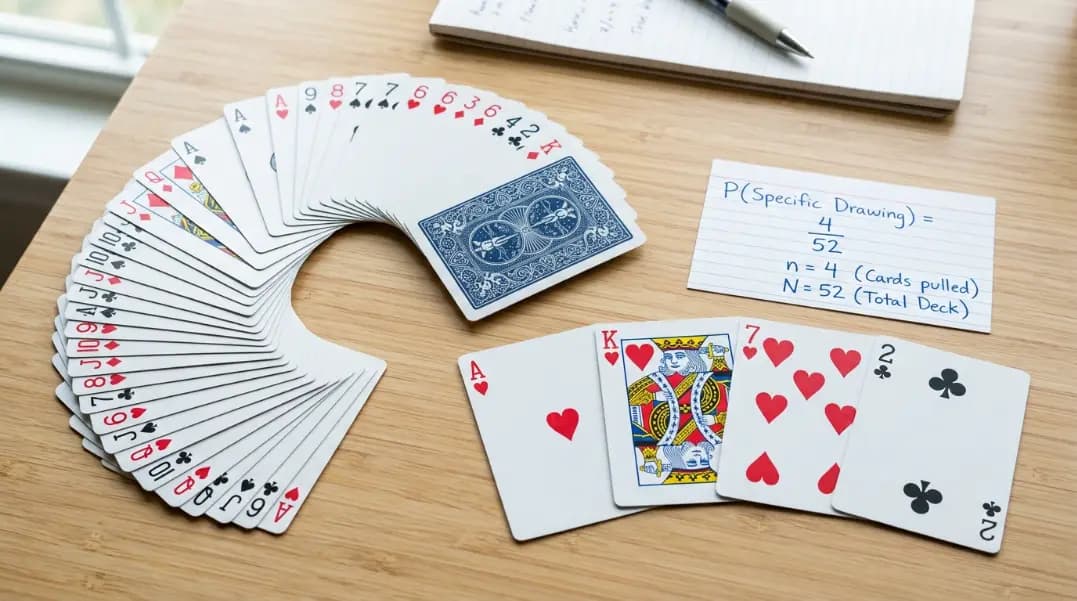
A standard deck has 52 cards: 4 suits (spades, hearts, diamonds, clubs) each containing 13 ranks (Ace through King). Every rank appears exactly 4 times, one per suit. No card appears more than once.
Three categories matter more than individual ranks in most probability calculations:
- Face cards: Jack, Queen, King. 12 total (3 ranks × 4 suits).
- 10-value cards: 10, Jack, Queen, King. 16 total (4 ranks × 4 suits). All four count as 10 in Blackjack, which is why this group has disproportionate impact on bust probability.
- Red and black cards: Hearts and diamonds are red, 26 total. Spades and clubs are black, 26 total.
Understanding which group a card belongs to is faster than tracking individual cards for most probability applications.
Single-Draw Probability Table
All probabilities below assume a full 52-card deck with no prior draws.
| Draw condition | Cards that qualify | Probability | Percentage |
|---|---|---|---|
| One specific card (e.g., queen of hearts) | 1 | 1/52 | 1.92% |
| Any card of one specific rank (e.g., any 7) | 4 | 4/52 = 1/13 | 7.69% |
| Any card of one specific suit (e.g., any diamond) | 13 | 13/52 = 1/4 | 25.00% |
| Any red card | 26 | 26/52 = 1/2 | 50.00% |
| Any face card (J, Q, K) | 12 | 12/52 = 3/13 | 23.08% |
| Any 10-value card (10, J, Q, K) | 16 | 16/52 = 4/13 | 30.77% |
| Any Ace | 4 | 4/52 = 1/13 | 7.69% |
| Any number card (2 through 10) | 36 | 36/52 = 9/13 | 69.23% |
| Any card that is not a spade | 39 | 39/52 = 3/4 | 75.00% |
| Any card above a 9 (10, J, Q, K, A) | 20 | 20/52 = 5/13 | 38.46% |
The 10-value card row (30.77%) is the most important number in Blackjack. Nearly one in three cards from a fresh deck counts as 10, which is why the standard strategy is built around assuming the dealer's hidden card is a 10.
How Probability Updates After Each Draw
This is the core mechanic that separates card probability from dice or coin probability. When a card is drawn and not replaced, the probabilities for all subsequent draws shift. Every card draw is a dependent event: it changes the odds of every future draw.
The formula:
If r cards remain that qualify, and n cards have already been drawn:
P(next draw qualifies) = r / (52 − n)
Example 1: Aces depleting across a session
| Aces drawn | Aces remaining | Cards remaining | P(next card is Ace) |
|---|---|---|---|
| 0 | 4 | 52 | 4/52 = 7.69% |
| 1 | 3 | 51 | 3/51 = 5.88% |
| 2 | 2 | 50 | 2/50 = 4.00% |
| 3 | 1 | 49 | 1/49 = 2.04% |
| 4 | 0 | 48 | 0/48 = 0.00% |
After all four Aces have appeared, the probability of drawing an Ace is zero for every remaining card in that deck. The digital card picker tracks this exactly within a session.
Example 2: Heart probability after known hearts have appeared
Base rate: 13 hearts in 52 cards = 25.00%.
After 20 draws where 7 hearts appeared: 6 hearts remain in 32 remaining cards. P(next card is a heart) = 6/32 = 18.75%.
The base rate was 25%. Seeing more hearts than the base rate early in the deck reduces the probability of drawing hearts in the second half. The deck always balances to 13 hearts total. More hearts early means fewer hearts remain.
Example 3: 10-value card depletion (the Blackjack tracking scenario)
Base rate: 16 ten-value cards in 52 = 30.77%.
After 26 draws where 10 ten-value cards appeared: 6 ten-value cards remain in 26 remaining cards. P(next card is 10-value) = 6/26 = 23.08%.
Compare to the base rate of 30.77%. A depleted 10-value pool reduces bust probability, changes the dealer's bust likelihood, and shifts whether doubling or splitting is correct. This is the information that card counting in Blackjack formalizes.
Two-Draw Sequential Probability (Without Replacement)
Two consecutive draws from the same deck are dependent events. The second draw probability is conditioned on what was drawn first.
Formula: P(first AND second both qualify) = P(first qualifies) × P(second qualifies, given first was drawn)
| Scenario | Calculation | Probability |
|---|---|---|
| Two Aces in a row | (4/52) × (3/51) | 0.45% |
| Two hearts in a row | (13/52) × (12/51) | 5.88% |
| Two face cards in a row | (12/52) × (11/51) | 4.98% |
| Two red cards in a row | (26/52) × (25/51) | 24.51% |
| Two 10-value cards in a row | (16/52) × (15/51) | 9.05% |
| Ace then a 10-value card (one order) | (4/52) × (16/51) | 2.41% |
| 10-value card then Ace (other order) | (16/52) × (4/51) | 2.41% |
Blackjack natural in either order: Ace first then 10-value, or 10-value first then Ace. Combined probability: 2.41% + 2.41% = 4.83%.
This 4.83% figure is the origin of the natural Blackjack frequency cited in most strategy references. It applies to a fresh single-deck game before any cards have been dealt.
Poker Hand Probability Reference
The total number of distinct 5-card hands from a 52-card deck is C(52,5) = 2,598,960. Every poker hand probability divides by this denominator.
| Hand | Distinct combinations | Probability | 1 in X hands |
|---|---|---|---|
| Royal flush | 4 | 0.000154% | 649,740 |
| Straight flush (not royal) | 36 | 0.00139% | 72,193 |
| Four of a kind | 624 | 0.0240% | 4,165 |
| Full house | 3,744 | 0.144% | 694 |
| Flush (not straight) | 5,108 | 0.197% | 509 |
| Straight (not flush) | 10,200 | 0.392% | 255 |
| Three of a kind | 54,912 | 2.11% | 47 |
| Two pair | 123,552 | 4.75% | 21 |
| One pair | 1,098,240 | 42.26% | 2.4 |
| High card | 1,302,540 | 50.12% | 2 |
Three facts from this table that most poker introductions skip:
High card is the most common hand. Roughly half of all 5-card deals are high card hands. Most poker writing focuses on flushes and straights, which creates the impression that interesting hands are common. In a random 5-card deal, you are more likely to hold nothing than any made hand.
A straight is 2.5× more common than a flush (10,200 vs. 5,108 combinations). Flushes are roughly twice as rare as straights, which is why straights rank below flushes in the hand hierarchy. The ranking reflects frequency.
The gap between a royal flush and a full house is enormous. A full house appears roughly once in 694 hands. A royal flush appears once in 649,740 hands. The word "rare" applies to both, but a royal flush is 937 times rarer than a full house. These two hands belong to entirely different scales of rarity.
The card games guide covers how to use the card picker for poker hand practice sessions where you can observe these frequencies across actual draws.
Bust Probability in Blackjack by Hand Total
When deciding to hit, the probability of busting depends on your hand total and the cards remaining in the deck. From a fresh 52-card deck before any draws beyond your two starting cards:
| Hand total | Cards that cause bust | Count from fresh deck | P(bust on hit) |
|---|---|---|---|
| 11 or below | None | 0 | 0.0% |
| 12 | 10, J, Q, K | 16 | 30.8% |
| 13 | 9, 10, J, Q, K | 20 | 38.5% |
| 14 | 8, 9, 10, J, Q, K | 24 | 46.2% |
| 15 | 7, 8, 9, 10, J, Q, K | 28 | 53.8% |
| 16 | 6, 7, 8, 9, 10, J, Q, K | 32 | 61.5% |
| 17 | 5 through K | 36 | 69.2% |
| 18 | 4 through K | 40 | 76.9% |
| 19 | 3 through K | 44 | 84.6% |
| 20 | 2 through K | 48 | 92.3% |
These probabilities assume a full fresh deck. In a real game, adjust for removed cards. If four 6-value cards have already appeared and you hold 16, the busting cards drop from 32 to 28 out of the remaining pool. The bust probability drops from 61.5% to approximately 58.3%.
The 16 vs. dealer 7 decision is the canonical example. The 61.5% bust probability on the hit looks catastrophic. But if you stand, the dealer drawing to 17 or higher wins the hand the majority of the time. Basic strategy says hit because the dealer's likely sequence from 7 beats a standing 16 more often than the 38.5% chance of drawing a non-busting card saves you.
How Probability Updates in Real Time: The Card Counting Principle
Card counting is not about memorizing every card. It tracks the ratio of high-value cards to low-value cards remaining in the deck to calculate whether current probabilities favor the player or the dealer.
The Hi-Lo system assigns: +1 to cards 2 through 6, 0 to cards 7 through 9, and -1 to 10-value cards and Aces. A positive running count means more low cards have been played, leaving a higher proportion of 10-value cards. A deck with more 10-value cards:
- Increases the probability of a Blackjack natural (both player and dealer benefit, but the player gets paid 3:2 on a natural while the dealer does not)
- Increases bust probability for dealer hands, since dealers must hit until reaching 17
- Increases the value of doubling decisions, since a single draw is more likely to land on a 10
The card picker tracks exactly which cards have appeared in a session. Running practice hands and manually tracking the count after each card is drawn builds the conditional probability intuition that the Hi-Lo system structures formally. The random card generator guide covers how the picker's shuffle works to ensure each session starts from a genuinely randomized deck.
How to Use the Conditional Probability in Practice
Before each draw, ask: How many qualifying cards remain in the deck?
If you know 8 hearts have appeared across 30 drawn cards:
- Hearts remaining: 13 − 8 = 5
- Cards remaining: 52 − 30 = 22
- P(next card is a heart) = 5/22 = 22.7%
- Compare to base rate: 13/52 = 25.0%
The base rate is a starting point. The conditional rate is what actually applies once cards have been drawn.
For Blackjack decisions specifically: The only cards you need to track are the 10-value cards (10, J, Q, K). There are 16 of them. Track how many have appeared relative to total cards drawn. When 10-value cards have appeared at a higher-than-baseline rate (more than 16 out of 52, or 30.77% of draws), the remaining deck is lean on 10-value cards. This reduces both your bust probability and the dealer's bust probability from the running deck. When fewer 10-value cards have appeared than baseline, the remaining deck is rich in them.
This does not require memorizing every card. It requires knowing one number: how many 10-value cards have appeared versus how many were expected.
Testing These Probabilities with the Card Picker
The most effective way to understand probability is to observe it across many trials.
Single-card probability test: Draw one card at a time, predict the suit before each draw, and track accuracy across the full 52-card deck. Expected accuracy from random guessing: 25 percent. Use knowledge of suits already drawn to predict. Accuracy in the second half of the deck should be higher than in the first half when you adjust your prediction based on which suits have already appeared.
Poker hand frequency test: Draw 5 cards, identify the hand type, record it, reset the deck, and repeat. After 100 hands:
- Expected high card: approximately 50 hands
- Expected one pair: approximately 42 hands
- Expected two pair: approximately 5 hands
- Expected full house: approximately 0 to 1 hand (1 in 694 hands on average)
Results at 100 hands will vary significantly from expected values. Running 500 or more hands brings observed frequency within 10 percent of theoretical probability for common hands like one pair and high card. Rare hands like full house require thousands of trials to match theory closely.
Conditional probability exercise: Play through a full 52-card deck in the card picker without resetting. Before each draw, state the probability of drawing an Ace as a fraction based on how many Aces have already appeared. After all 52 cards are drawn, verify that exactly 4 Aces appeared, that the probability fractions you stated were correct at each step, and that the final probability before the last Ace was exactly 1 divided by the number of remaining cards at that point.
The random tools section has the dice roller and random number generator alongside the card picker. Comparing card draws (dependent events, without replacement) against dice rolls (independent events, full range each time) is one of the most direct ways to understand what makes card probability distinct.
For a practical application of these probability concepts in actual card game formats, the card games with a deck of cards guide covers how to run practice sessions for Blackjack, Higher or Lower, and poker hand analysis using the same card picker.