The default wheel treats every segment the same. Add six options and each has a 1-in-6 chance. That equal probability is exactly right for most uses. But some situations call for a different distribution: one option should land more often than another, by design, and the people spinning should know exactly why.
The wheel spinner assigns equal probability to each segment by default. You change that distribution without any special setting: add a segment more than once and its probability increases proportionally. The math is straightforward, the result is genuinely weighted, and the setup takes under a minute once you understand how the distribution works.
This guide covers what percentage wheels are, how to build one using duplicate segments, when unequal probability is the right choice rather than the wrong one, and the specific mistake that makes a weighted wheel unfair.
What Percentage Actually Means on a Wheel Spinner
A standard wheel spinner divides 100% probability equally across all segments. A six-segment wheel gives each segment 16.7%. A ten-segment wheel gives each 10%. Every spin is independent, and every segment has the same probability on every spin regardless of what landed before it.
A percentage wheel spinner changes that distribution intentionally. One segment might have a 50% chance. Another might have 25%. Two more split the remaining 25%. The wheel becomes biased by design, and the bias is determined by whoever builds the wheel.
This is different from a wheel being rigged. A rigged wheel produces results that do not match what is shown. A weighted wheel shows the actual probability through the visible segment counts, and results follow that distribution over many spins. The distinction matters for any use involving transparency or teaching.
The probability of any segment equals the number of times it appears on the wheel divided by the total number of segments:
- 10-segment wheel, segment appears once: 10% chance
- 10-segment wheel, segment appears three times: 30% chance
- 10-segment wheel, segment appears seven times: 70% chance
Every additional appearance adds exactly 1/N to a segment's probability, where N is the total segment count. The math does not require any tool-specific settings.
How to Build a Weighted Wheel Using Duplicate Entries
The practical method for creating a percentage wheel on any standard spinner is to add segments multiple times. Each duplicate increases that option's probability proportionally.
70/30 split between two options on a 10-segment wheel:
- Add Option A seven times (70% probability)
- Add Option B three times (30% probability)
50/25/25 split between three options on a 4-segment wheel:
- Add Option A twice (50% probability)
- Add Option B once (25% probability)
- Add Option C once (25% probability)
60/20/20 split between three options on a 5-segment wheel:
- Add Option A three times (60% probability)
- Add Option B once (20% probability)
- Add Option C once (20% probability)
40/40/20 split between three options on a 5-segment wheel:
- Add Option A twice (40% probability)
- Add Option B twice (40% probability)
- Add Option C once (20% probability)
The rule: target percentages must sum to 100%, and each percentage must be achievable as a whole-number fraction of the total segment count. You cannot represent 33.33% exactly on a 10-segment wheel (3 segments = 30%, 4 segments = 40%). For cases requiring finer granularity, increase the total segment count. On a 30-segment wheel, you can represent any multiple of 3.33%, which covers most practical distributions.
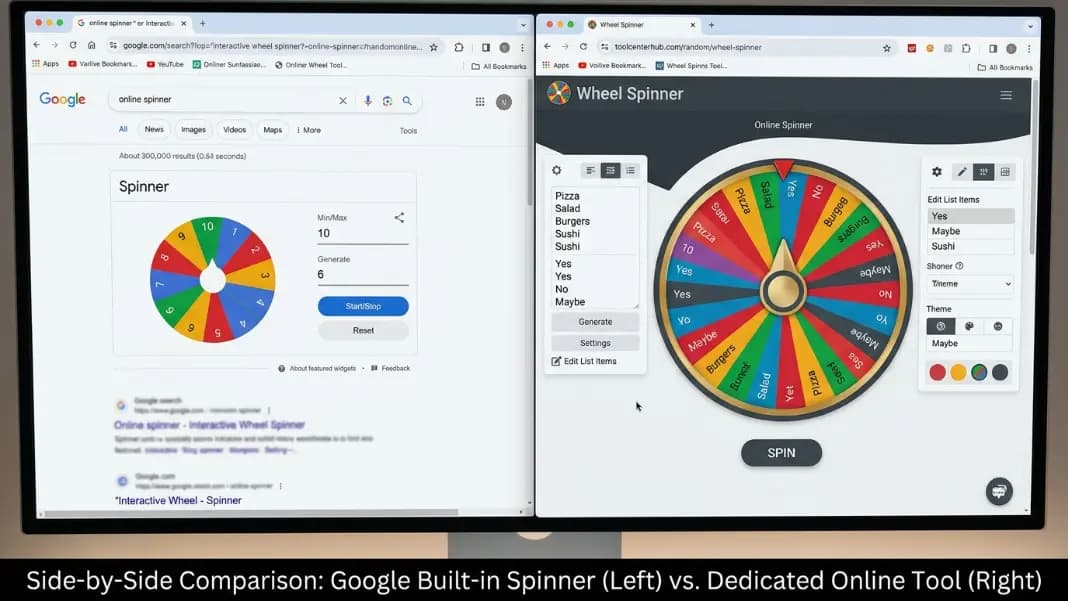
Open the wheel spinner, set up your segments with the correct duplicate counts, and the wheel reflects the weighted distribution you specified. The visible segment sizes confirm the ratios at a glance.
Equal vs Unequal Probability: When Each Is the Right Choice
Equal probability is correct for most everyday uses. Drawing a raffle winner, picking a student for a question, assigning tasks among team members, selecting a game activity: all of these require every option to have the same chance. Introducing weighted probability where equal probability is expected is not customization. It changes the outcome distribution in ways participants have not agreed to.
Unequal probability makes sense when the real-world situation being modeled has unequal odds.
Classroom probability demonstrations: Teaching students that probabilities do not have to be equal, and showing how duplicate segments shift the distribution, is one of the clearest hands-on approaches. The wheel makes abstract percentages observable and immediate.
Games with tiered risk: A game mechanic where landing on a jackpot should be rare benefits from a weighted wheel. The jackpot segment appears once. The try-again segment appears eight times. Players see the odds before spinning and understand the risk without a calculation.
Simulations: A classroom activity modeling weather patterns might need rain 40% of the time, sun 40%, and clouds 20%. A genetics activity might model Punnett square outcomes using a weighted wheel rather than a grid. The wheel makes the probability distribution physical rather than abstract.
Personal decisions with preferences: A dinner decision where three options are all acceptable but two are strongly preferred over one can reflect that preference in the wheel. Two favored options get two segments each, the third gets one, and the result still feels random but honors the actual preference distribution honestly.
Percentage Wheel for Games With Different Risk Levels
Weighted wheels change game mechanics in ways equal-probability wheels cannot. Two structures come up most often in practice:
Risk-reward wheels: Most segments produce safe or neutral outcomes. One or two carry a penalty or jackpot. The rare result feels significant because it genuinely is. The tension before each spin comes from knowing the jackpot is real but unlikely.
Example structure on a 10-segment wheel:
- 8 safe segments (80%)
- 1 bonus segment (10%)
- 1 penalty segment (10%)
Players can calculate their odds by counting segments. Transparency is built into the visible wheel.
Escalating difficulty: Early in a learning game, a wheel weighted toward easier questions keeps new players engaged and building confidence. As players advance, the wheel shifts toward harder or riskier results. Both configurations use the same tool with different segment ratios.
Spin-again mechanics: Adding a "spin again" segment gives the wheel a built-in reroll with a specified probability. A 20% spin-again rate means roughly 1 in 5 spins triggers a second spin, which can chain for longer strings if that outcome is part of the game design.
For public draws and giveaways where equal probability is the stated terms, a flat equal-probability wheel is the only acceptable choice. The spin the wheel for giveaways guide covers equal-probability prize wheel setups and how to document them for participants.
Teaching Statistics and Probability With a Percentage Wheel
A percentage wheel is one of the most effective visual aids for probability concepts because it makes the distribution visible as physical segments of a circle. Students can see the percentage before the spin and track whether results match over time.
Law of large numbers: Set up a 70/30 weighted wheel. After 10 spins, the observed distribution will often look nothing like 70/30. Short-run results diverge from probability. After 50 spins, results start clustering toward the expected ratio. After 100 or more, the distribution converges noticeably. Running this live in class demonstrates why probability describes long-run behavior, not guaranteed short-run outcomes.
Expected value: A wheel where the 50% segment earns 2 points and the 50% segment loses 1 point has a positive expected value of 0.5 points per spin on average. Students can calculate expected value from the wheel's visible structure before seeing any results, then verify against actual outcomes over many spins.
Independence of events: Each spin of a weighted wheel is statistically independent of every previous spin. A 30% segment that has not appeared in 20 consecutive spins is not due. The next spin's probability is still exactly 30%. The wheel has no memory. This is the concept most commonly misunderstood about random events, and a live spinning demonstration makes independence more tangible than any explanation.

Geometric probability connection: The area of each segment equals its probability, expressed as a fraction of the full circle. Students can measure the angle of each segment (probability × 360 degrees) and verify it matches the stated percentage. This connects geometric reasoning directly to probability concepts using a tool that is already running in front of them.
Binomial distribution introduction: Run 10 spins of a 50/50 wheel and record the number of times each result appears. Repeat the 10-spin trial multiple times. The distribution of "how many times the 50% segment appeared in 10 spins" across many trials follows a binomial distribution. The wheel generates data for a distribution lesson without any simulation software.
The Mistake That Makes a Percentage Wheel Unfair
A weighted wheel is fair when the weights are disclosed before spinning and all participants understand the distribution. It is unfair in two specific situations.
The first is using a weighted wheel for a draw where participants believe the odds are equal. A raffle where one participant has a 50% chance of winning and others each have a 10% chance is not a raffle under the normal meaning of the word. Anyone spinning a wheel in front of participants who expect equal probability has an obligation to show them a wheel with equal segments.
The second is adjusting weights after participants have joined the draw. Setting the wheel with one distribution, spinning, and then changing segment counts before another round without disclosing the change is manipulation. The initial stated odds should match the actual wheel for the duration of the draw.
For any public or group draw where fairness is the stated requirement, use a standard equal-probability wheel with one segment per option. Weighted wheels belong in situations where the unequal distribution is the design feature everyone agreed to, not a hidden variable underneath a fair-looking interface.
The are online random generators really random guide covers how digital wheel spinners generate results and what genuine randomness looks like in software, which is useful context for anyone building or evaluating either equal or weighted wheel setups.
When a Percentage Wheel Is the Right Tool
A standard equal-probability wheel handles most situations: team assignment, student selection, public giveaway draws, game night decisions. Equal probability is also its own form of transparency. Participants understand it without counting segments.
A percentage wheel is the right choice in four situations:
You are modeling an unequal real-world probability. Weather outcomes, genetic ratios, economic scenarios, and historical base rates are not equal across outcomes. A wheel that reflects real-world probabilities produces a more accurate simulation than an equal-probability wheel.
You are teaching probability concepts where unequal distribution is the lesson. The weighted wheel is not a shortcut for a rigged result. It is a visual tool for demonstrating how probability works when outcomes are not equally likely.
You are designing a game where risk levels are an explicit part of the mechanic. The jackpot is rare by design. Players see that rarity in the segment count before they spin.
You are making a decision where your actual preference distribution is not flat. Two strongly preferred options and one acceptable option can be reflected honestly in a 40/40/20 wheel rather than pretending all three are equally desired.
The random tools section has additional tools for situations where a wheel result is not the right structure. Number generators handle range-based probability. Coin flips produce a true 50/50 result in one tap. Team generators distribute groups evenly when the goal is equal group size rather than equal individual probability.