Pick a number between 1 and 10. Most people land on 7.
That is not a coincidence or a quirk of a particular cultural moment. Research in cognitive psychology finds that approximately one in four people choose 7 when asked to select a random number from 1 to 10, compared to the 10 percent each number would receive from a genuinely random process. 7 is overrepresented by a factor of 2.5. Meanwhile 1 and 10, which are both valid answers, are each chosen at roughly half to one-third the expected rate.
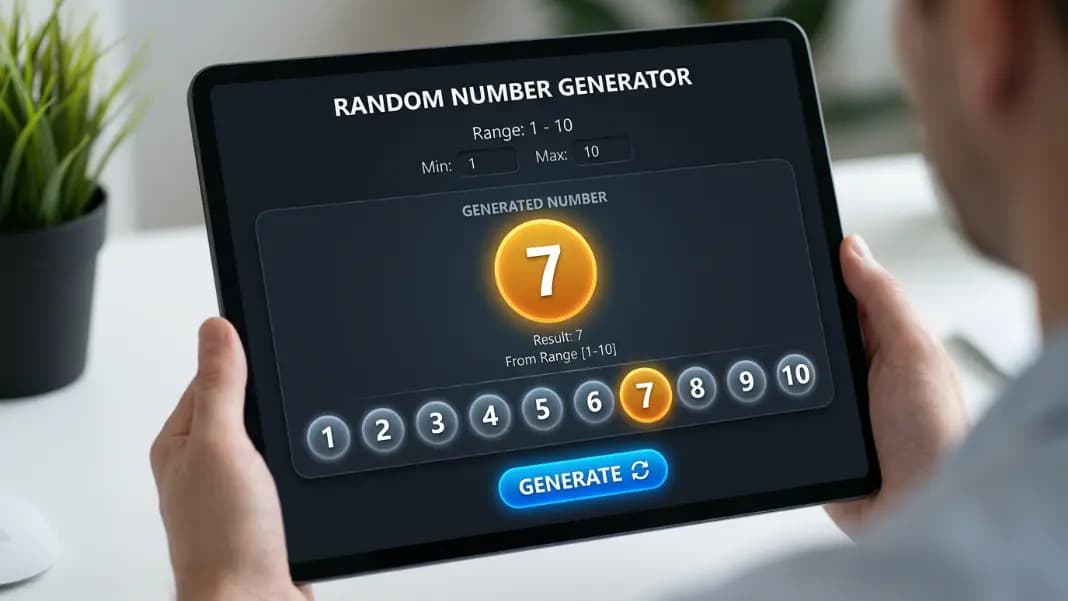
The Random Number Generator removes all of it. Set the minimum to 1 and the maximum to 10. Every number from 1 to 10 has exactly equal probability on every draw, no number is avoided because it feels like the edge of the range, and no number is favored because it reads as satisfyingly irregular. This guide covers why the human bias exists, how it affects rating scales, and what each format does better.
How the Generator Works
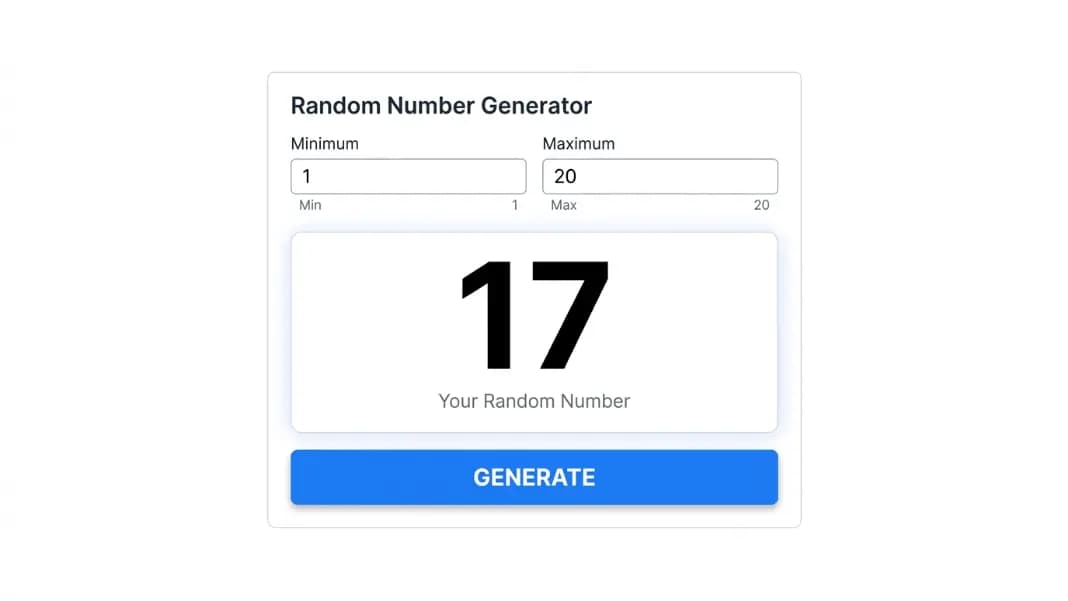
The Random Number Generator uses the browser's Web Crypto API, which draws entropy from hardware-level sources including operating system randomness and system event timing. The result is determined before any visual display. An animation or countdown on screen is a visualization of a result that was already fixed before the display started.
Each number from 1 to 10 has exactly a 10 percent probability on every independent draw. The generator has no memory between draws. Getting 7 three times in a row does not change the probability of 7 on the fourth draw. It remains 10 percent, the same as every other number in the range.
Why People Pick 7: The Cognitive Mechanism
The 7 preference is documented across cultures and age groups in cognitive psychology research. It is not a Western or English-language effect. The mechanism behind it is consistent.
People associate randomness with irregularity. A number that looks "irregular" registers as more random than a number that looks structured or expected. In the 1-to-10 range, 7 occupies a position that satisfies several cognitive criteria for looking random simultaneously.
It is not at either edge (1 or 10), so it does not feel like a boundary pick. It is not in the exact center (5 or 5.5), so it does not feel like the obvious middle. It is not a round number (5, 10), which feel too clean. It is not paired closely with the boundaries (2 or 9), which feel like near-edge choices. Of all the numbers in the range, 7 reads as the most irregular, and irregular is what people's intuition reaches for when they want to seem random.
The problem is that this process produces the opposite of randomness. When everyone in a group applies the same "which number feels most random" heuristic, they converge on the same answer. A room of people all picking the most-random-seeming number produces a distribution where 7 appears 25 percent of the time. That is not random. It is a coordinated result produced by shared cognitive shortcuts.
For any situation where genuine equal probability matters, a generator is the only mechanism that actually delivers it.
Boundary Avoidance: Why 1 and 10 Are Underchosen
Boundary avoidance is a separate bias from the 7 preference, though the two reinforce each other.
When a range is stated verbally ("pick a number between 1 and 10"), most people interpret the boundary numbers as being at the edge of the spirit of the request, not fully inside it. Choosing 1 or 10 feels like picking the endpoint rather than "really" choosing from the range. This happens even though 1 and 10 are explicitly included and mathematically identical in probability to every other number.
The practical result: 1 and 10 are each chosen at approximately 3 to 5 percent of the time in research settings, compared to the expected 10 percent. Together they account for roughly 6 to 10 percent of choices when each should account for 20 percent combined. The numbers 2 and 9 show a milder version of the same effect, underchosen because they sit one step from the boundary.
Boundary avoidance explains why "pick a number between 1 and 10" tends to produce answers clustered in the 3 to 8 range in practice, even before accounting for the 7 bias on top of that.
Rating Scale Psychology: When 1 to 10 Means 7 to 8
The same biases that distort number selection in games distort data collection when 1 to 10 is used as a rating or self-assessment scale.
When someone is asked to rate their confidence, satisfaction, or understanding on a 1-to-10 scale, responses cluster around 7 to 8 rather than distributing evenly across the full range or centering on 5.5, the mathematical midpoint. Three overlapping mechanisms drive this.
Extremity avoidance. Giving a 1 or a 10 feels like making a dramatic statement. Most people are reluctant to claim maximum or minimum anything, even when those scores would be accurate. The result is that the effective scale in practice is usually 4 to 9, not 1 to 10.
Positive response bias. On scales that measure self-assessment, people systematically rate themselves slightly higher than a neutral evaluation would produce. Saying "7 out of 10 confidence" reads as modestly positive. Saying "4 out of 10 confidence" reads as admitting significant doubt, which requires a different threshold of self-disclosure.
Acquiescence. People answering questions from an instructor, manager, or organizer tend to anchor toward agreement and positive framing. A "how confident are you?" question elicits slightly higher numbers than a neutral response distribution would show.
The practical consequence for anyone using 1-to-10 self-assessments: a room where everyone answers 7 or 8 tells you less than it appears to. The scale is not distributing across 10 options. It is distributing across 2 to 3. If granular differentiation matters, consider narrowing the scale to 1 to 5, where boundary avoidance and extremity effects are proportionally smaller, or accept that 1-to-10 self-reports show relative ordering rather than absolute levels.

Common Uses for the 1-to-10 Range
Guessing games. One person thinks of a number between 1 and 10. Others try to guess it. Using a generator for the initial pick rather than a mental choice makes the game genuinely unpredictable. A person mentally picking a "random" number defaults to 7 at roughly 1-in-4 odds, which means experienced players who know this bias can guess 7 as a default and win more often than 10 percent would allow.
Assigning random order. Give each person in a group a number from 1 to 10. Generate a number. Whoever holds that number presents first. Remove the number from the range and generate again for second place. Continue through the group. This assigns a presentation or speaking order without any perception of favoritism, and it works for groups of up to 10 people with a single 1-to-10 range.
Decision tie-breaking. Two options, neither clearly better. Assign one option to 1 through 5 and the other to 6 through 10. Generate a number and commit to the result. This is mechanically identical to a coin flip but works well in group settings where a specific number on a shared screen feels more neutral than calling heads or tails.
Game mechanics. Board games requiring a random modifier, card games where a player draws a challenge strength, or custom RPG rules where the call needs a d10 equivalent. The Random Number Generator handles any range without requiring physical dice.
Teaching Probability With a 1-to-10 Generator
The most effective classroom exercise starts before the generator runs.
Ask every student to write down a number between 1 and 10 that feels random to them. Collect the answers and plot the distribution on the board. The 7 concentration and the thin edges will be visible immediately. Then ask the class: "Is this what random looks like?" The answer is no, and most students already sense it when they see the chart.
Then run 50 generator draws and plot those alongside the student distribution. The generator result will look uneven too: some numbers appearing 8 times, others appearing 3 times. That unevenness is correct, not an error. It demonstrates that small samples are genuinely irregular even with perfectly fair probability. A perfectly even 5-per-number result from 50 draws would actually be suspicious, not reassuring.
As the sample grows to 100 draws, then 200, the distribution converges toward the expected 10 per number. The contrast between the student "random" distribution (clustered, predictable) and the generator distribution (uneven but converging) makes two things visible at once: that human intuition about randomness is systematically biased, and that genuine randomness looks irregular at small scales.
For probability calculation exercises, the 1-to-10 range supports single-event questions ("what is the probability of generating a number greater than 7?"), compound questions ("what is the probability of generating two numbers that add to less than 5?"), and sequential questions ("what is the probability of the same number appearing twice in a row?").
Physical d10 vs. Digital Generator
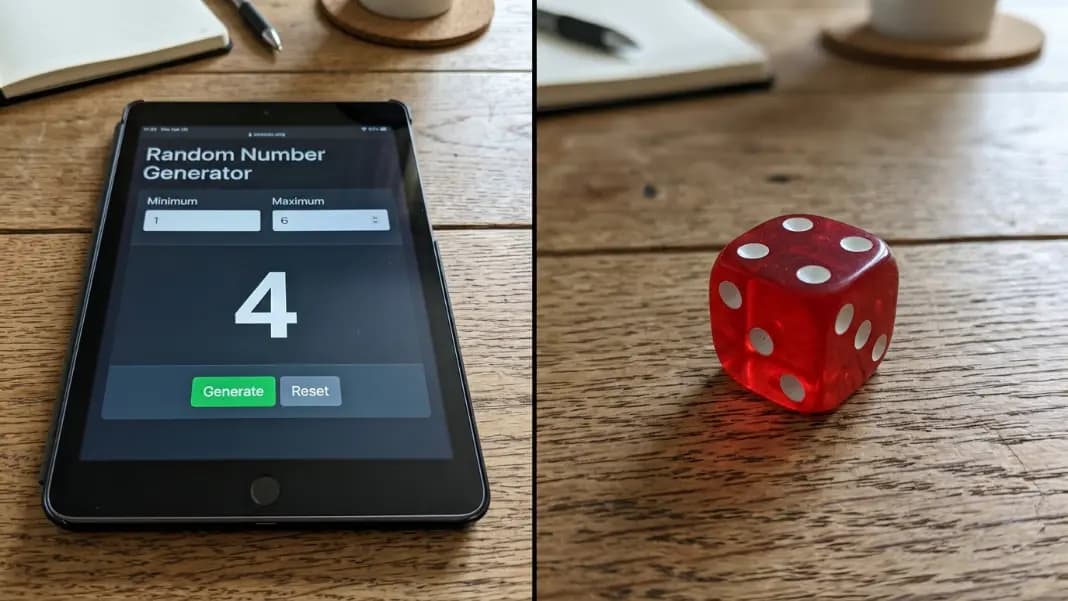
A standard ten-sided die covers the same range and produces equally random results. The choice between them depends on context.
Physical dice work better when the act of rolling is part of the experience. In board games, tabletop RPG sessions, and face-to-face group activities where the roll carries social weight, a real die handles the moment better than a phone screen. The tactile act of rolling is part of the ritual.
A digital generator works better for remote settings, shared screen presentations, and any range that does not match a physical die. The 1-to-10 range happens to match the d10, but 1 to 7, 1 to 9, or 1 to 15 do not. The generator handles any range with equal ease. For online tabletop play, a generator visible to all players serves the same purpose as a physical roll and keeps the result in a format everyone can see simultaneously.
For situations where the same random process needs to handle name selection or non-numeric choices, a wheel spinner with custom segments lets you add names or options directly rather than mapping numbers to a list.
No-Repeat Generation: Drawing 1 to 10 in Order
Standard generation with replacement can produce the same number more than once. If each number needs to appear exactly once in a random sequence, you need no-repeat generation.
The most common use is assigning a random order to a group of exactly 10 people. Generate a number, assign that position to the person holding it, remove the number from the pool, and continue. Each subsequent draw has one fewer option.
For groups larger than 10, the same logic applies with a wider range. The Random Number Generator handles this workflow directly. For visual sequential assignment where each removal is shown on screen, a wheel spinner with segment removal after each spin produces the same result in a format the whole group can watch.
For range-specific applications in larger contexts, the Random Number Generator 1 to 100 guide covers 100-range uses including percentage thinking, wargame mechanics, and large-group draws. For binary decisions, the random tools section has a dedicated coin flip. For drawing names rather than numbers, a wheel spinner provides the visual equivalent.