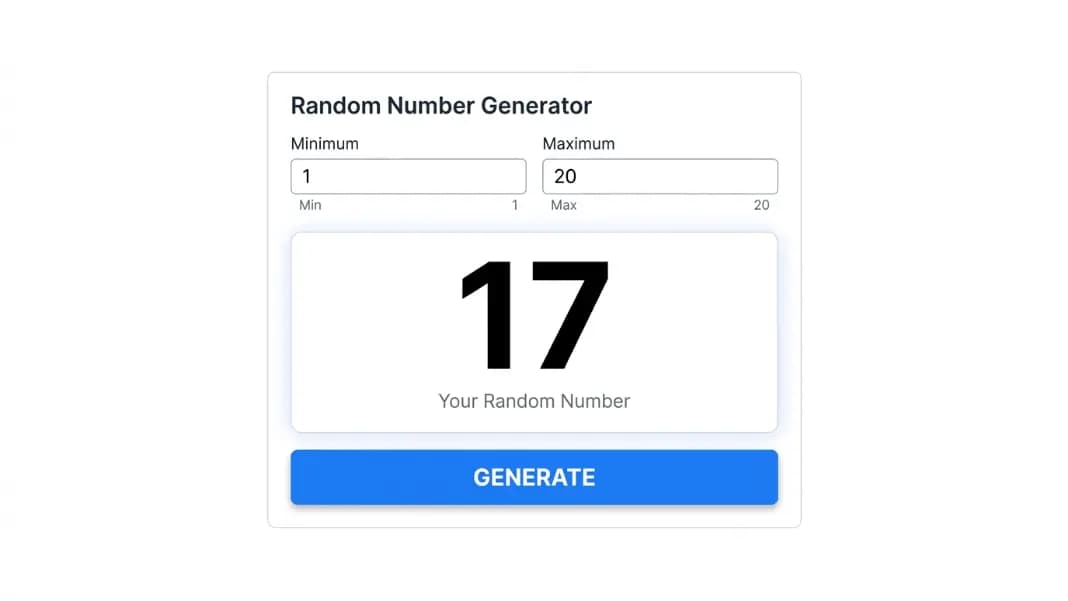
A random number generator set to 1-to-100 produces results that most people interpret without explanation. When the generator returns 73, the brain reads it as 73 percent. When it returns 12, it reads as 12 percent. No other standard range does this. A result of 4 from a 1-to-6 range has no inherent percentage meaning. A result of 17 from a 1-to-20 range requires a calculation to translate into a probability. The 1-to-100 range maps directly to percentage cognition because it is the same scale people use for grades, statistics, and everyday probability estimates.
The random number generator at ToolCenterHub handles any range. This guide covers why the 1-to-100 range is specifically suited to probability work, how roll-under systems in wargames and RPGs exploit this property, how to use the range for classroom simulations, and when a different range is the better choice.
Why 1 to 100 Is a Different Kind of Range
The cognitive familiarity with 1-to-100 comes from exposure to percentage-based systems throughout education, sports, and everyday communication. Students grow up with grade percentages. Sports statistics report batting averages, completion percentages, win rates. Surveys and polls express results as percentages. Weather forecasts give rain probability as a percentage.
This creates shared reference points that no other random number range has:
- Results in the 90s read as "near-certain" or "excellent"
- Results around 70-80 read as "likely" or "good"
- Results near 50 read as "coin flip" territory
- Results in the 20s and below read as "unlikely" or "rare"
When a group sees a 1-to-100 result and needs to quickly agree on what it means, those reference points eliminate argument. Everyone already has a working model for what 73 means relative to 40 or 90. This shared interpretation is exactly what percentage-based games and simulations need.
A 1-to-20 range does not produce this effect. Neither does 1-to-6 or 1-to-12. Only 1-to-100 maps directly to the percentage language people already use.
Roll-Under Systems: The Range Where Skill Score Equals Success Probability
Roll-under systems are the most elegant use of 1-to-100 generation. In a roll-under system, each character or unit has skill scores that run from 1 to 100. To attempt an action, a player generates a number from 1 to 100. If the result equals or falls at or below the skill score, the action succeeds.
The key property: the skill score and the success probability are numerically identical. A character with a Shooting skill of 65 succeeds whenever the generator returns 1 through 65. That is exactly a 65% success rate. The number on the character sheet is the probability. No conversion, no modifier arithmetic, no table lookup.
This system appears in several major game systems:
| Game system | How 1-to-100 is used |
|---|---|
| Warhammer Fantasy Roleplay | Characteristics (Strength, Agility, Intelligence) run 1-100; roll equal to or under your score to succeed |
| Call of Cthulhu | Skills run 1-100; roll under skill for success, extreme success at skill divided by 5 |
| Classic wargame percentile systems | Unit morale, special ability activation, and event tables use 1-100 rolls against target numbers |
| Percentile encounter tables | RPG sourcebooks list 1-100 entries for loot, weather, or random encounters |
The practical advantage for teaching new players: explaining the rule requires one sentence. "Your Strength is 60. Roll 60 or lower to succeed." A player sees their character sheet, sees 60, and knows immediately that they succeed roughly three times in five and fail roughly twice in five. No additional mental model is needed.
Percentile dice (two 10-sided dice, one for tens and one for units, read as a two-digit number from 01 to 100) replicate this exactly. A digital generator set to 1-to-100 produces the same distribution and can be used directly in any system that calls for percentile dice.
Grade-Banding Simulations for Classroom Probability
The 1-to-100 range maps onto standard academic grade bands so cleanly that it builds an effective probability simulation with no additional setup.
Grade band assignment:
- 1-59: Failing (F)
- 60-69: D
- 70-79: C
- 80-89: B
- 90-100: A
Each band contains a fixed number of values out of the 100 possible results. The B band contains exactly 10 values (80, 81, 82...89), which means any single draw has a 10% chance of landing in the B band. The failing band contains 59 values, so any single draw has a 59% chance of being a failing result.
The classroom exercise:
- Generate 30 numbers from 1 to 100. Count results per band.
- Compare to theoretical expectation: B band expected ~3 results out of 30, A band expected ~3 results, F band expected ~18 results.
- Run the simulation five more times. Record band counts each time.
- Ask students: why does the actual count differ from the expected count? Why does it vary across runs?
Students see two things simultaneously. First, the theoretical probability for each band is fixed and calculable. Second, small sample sizes produce visible deviation from theory even with perfect randomness. A 30-draw simulation might produce 5 results in the B band one run and 1 result the next. Neither outcome means the generator is broken. Both outcomes are expected given the small sample size.
The random number generator can produce 30 results in a single operation. This makes live classroom demonstrations fast enough to run multiple trials within a single period without manual re-entry between runs.
For a dedicated classroom tool with student selection features and projector-ready display, the random number generator for classroom guide covers those specific formats.
Weighted Outcome Simulation: 1 to 100 as a Probability Engine
Any probability from 1% to 99% can be resolved with a 1-to-100 generator without any additional calculation. This makes it a general-purpose tool for resolving chance-based events in a way that participants can inspect and verify.
The setup: define the event and its percentage probability. Generate a number from 1 to 100. If the result falls within the designated range, the event occurs.
| Event | Stated probability | Success range |
|---|---|---|
| Coin flip | 50% | 1 to 50 |
| Drawing a spade from a shuffled deck | 25% | 1 to 25 |
| 70/30 weighted outcome | 70% | 1 to 70 |
| 1-in-10 chance | 10% | 1 to 10 |
| 1-in-3 chance | 33% | 1 to 33 |
| 1-in-20 chance | 5% | 1 to 5 |
The transparent nature of this format is its primary advantage. If a group needs to resolve a 40% probability event and someone questions the outcome, the number on screen and the stated 1-to-40 success range are both visible and verifiable. There is no hidden calculation. Anyone in the group can check the result themselves.
This format is common in board game prototyping, tabletop wargame event resolution, and teaching exercises where students need to run repeated trials and see whether the empirical frequency of outcomes matches the stated probability over time.
Comparing 1-to-100 to Other Common Ranges
The 1-to-100 range fits a specific set of tasks well and fits others poorly. Using it correctly means knowing when a different range is the better choice.
Use 1-to-100 when:
- The result needs to map directly to a percentage without any additional calculation
- You are running a roll-under skill check system where skill score equals success probability
- You need to simulate a probability-based event and the group needs to verify the result
- You need granularity at roughly the 5% level (distinguishing a 35% chance from a 40% chance meaningfully in a small number of trials)
Use 1-to-20 when:
- You are playing a D&D-style game system where 1 is a critical failure and 20 is a critical success
- Modifiers shift the target number rather than the roll itself
- The specific values at the extremes carry mechanical meaning beyond just high or low
Use 1-to-6 when:
- Simulating a standard six-sided die for a board game
- Rolling for a game that specifies a d6 as its mechanic
Use a larger range (1-to-1000 or beyond) when:
- Picking a winner from a very large entry pool where each person holds one ticket number
- Generating an identifier number rather than a probability result
For the 1-to-10 range specifically, which carries its own cognitive properties including the consistent overselection of 7 and the avoidance of boundary numbers, the random number 1 to 10 guide covers the human bias patterns in that range and why they matter for classroom exercises and game design.
For every random tool in one place, the random tools section lists the full set: wheel spinner, dice roller, coin flip, and team generator alongside the number generator.